Data updated October 20, 2026 · All 58 Counties
California Fire-Damaged Homes: Off-Market Leads For Investors, Flippers And Wholesalers
As of October 20, 2026, California has 5,596 fire-damaged properties on record across all 58 counties.
Fire-damaged homes are among the clearest distressed properties in California real estate — the kind investors, fix-and-flippers and wholesalers search for. This list runs year to date and is updated weekly. A fire-damaged property list is the set of homes and buildings damaged by a fire inside the structure — not a brush fire or a car fire. Every record shows what an investor needs to size the deal: when it happened, how far the fire went (the whole structure, one room, a contained kitchen or chimney fire), how badly the building was damaged, and whether anyone was living there at the time. Properant matches each one to its parcel and shows it on that property's profile, beside the owner and the equity.
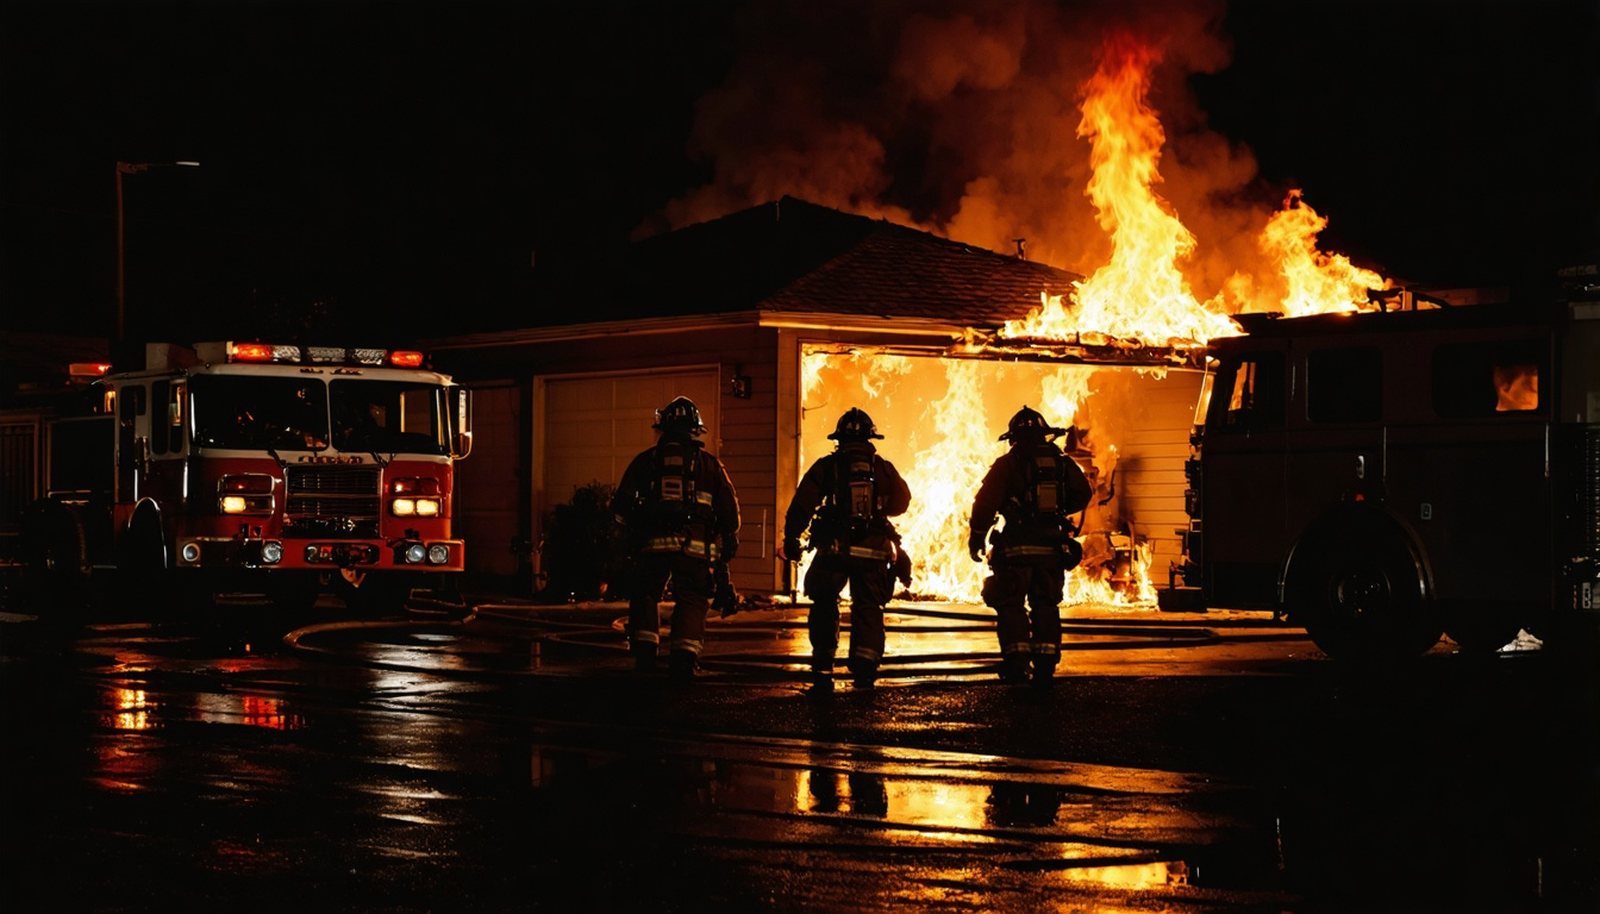
Search These 5,596 Fire-Damaged Properties
7-Day Free Trial · No Credit Card Required · One-Click Sign-In With Google
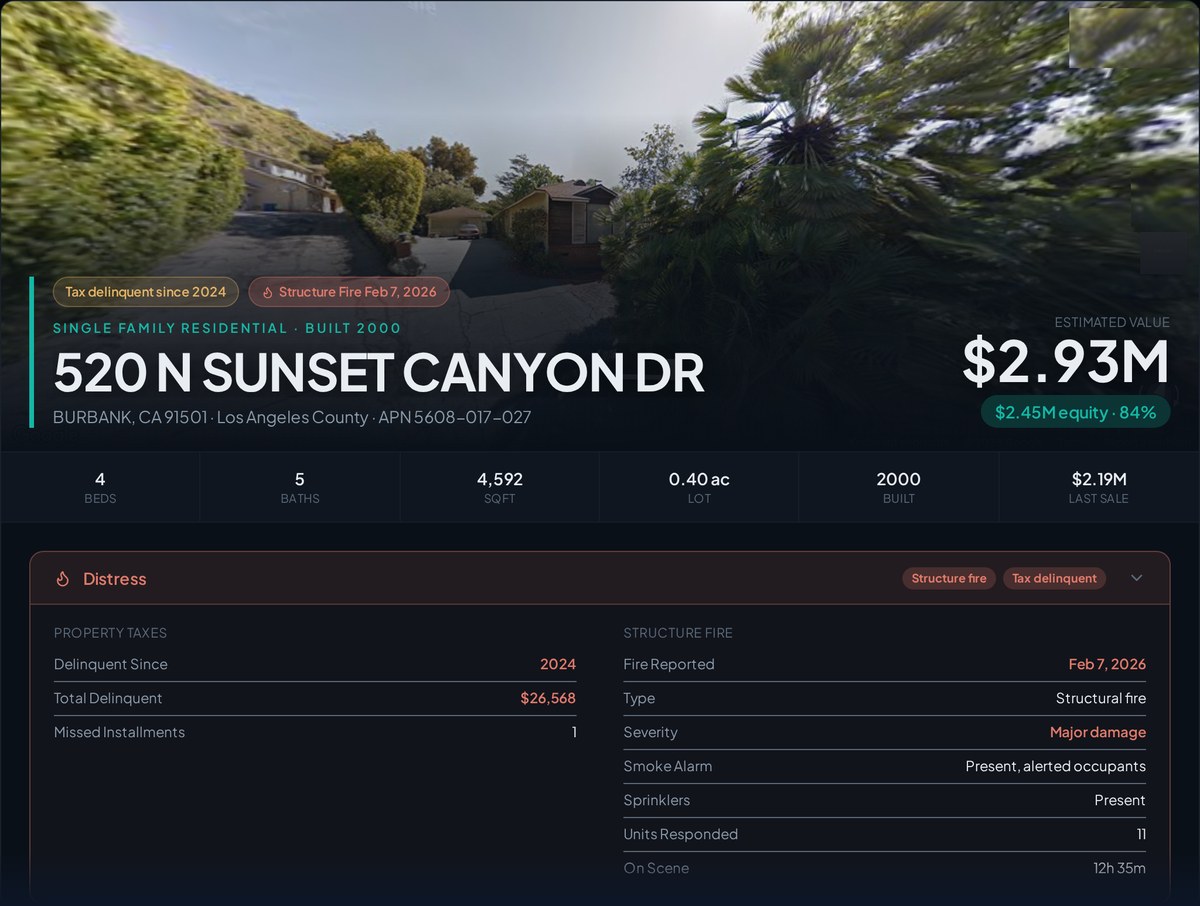
What's on Every Property Record
Fire-damaged houses almost never sell the way other houses do. The owner is living somewhere else, the house cannot be lived in, and very few people want to manage a rebuild — so the property sells as-is, off the MLS, to an investor who can. That is why a structure fire is one of the most reliable motivated-seller signals there is, and why this list is built for fix-and-flippers and wholesalers: a known scope of work, a discounted price, and an owner who usually wants out. Each property shows the fire alongside everything else Properant knows about the parcel — the owner's record and mailing address, open loans and true equity, tax status, liens, and foreclosure stage — so you can tell a burned-out rental with a distant landlord from a family that will rebuild.
What a fire-damaged record tells you before you ever drive by
Each record carries the facts an investor needs to size the deal: the date of the fire, whether it involved the structure itself or stayed in one room, how badly the building was damaged, the room the fire started in, and whether the building was occupied or sitting vacant when it burned. Layer that with the equity, the owner's mailing address and any other distress flag on the parcel and the list narrows to the owners who need an as-is offer. A vacant house with major structural damage and an absentee owner is a different conversation from an occupied home with a contained kitchen fire — and you can tell them apart from the list before making a single call.
How fix-and-flippers and wholesalers work a fire list
Filter to moderate or major damage, cross it with equity and ownership — an owner with real equity and a mailing address somewhere else is the classic seller — and reach out while the owner is still deciding what to do with the property. Wholesalers pair the property with a rehab buyer who wants the discount and can carry the scope; flippers underwrite the rebuild against the after-repair value of the street. Either way the fire date gives you the timing: the weeks after the fire, before the owner has decided what to do, are when an as-is offer lands.
Search fire-damaged properties in the live database →Potential code enforcement liens: fire-damaged homes left vacant, boarded up and in violation
Investors who search for boarded-up houses, vacant properties, code violations and code enforcement liens are usually looking for the same seller a fire produces. After a fire the house sits vacant and gets boarded up, and it typically becomes a code violation: code enforcement takes action on the vacant, boarded-up structure, open to entry, windows boarded, debris on the lot, and can put a code enforcement lien or a code violation lien against the property, along with nuisance abatement charges. Serious fires often leave the house red-tagged as unsafe to occupy, and a burned-out house that stays abandoned collects code violation liens and code enforcement liens over time. By then the owner is often ready to sell as-is. A fire-damaged property list reaches that owner earlier, at the fire itself, with the owner of record, the mailing address and the equity on every parcel, usually well before a violation or a lien is ever filed.
Frequently Asked Questions
How many fire-damaged properties are there in California?
Properant tracks 5,596 fire-damaged properties across California's 58 counties as of October 20, 2026, each matched to the parcel it happened on, year to date.
Why do fire-damaged properties usually sell to investors?
Because a fire changes the seller's math. The family has relocated, the house cannot be lived in, and rebuilding means a year of contractors, permits, and decisions most owners would rather not make. A cash buyer who takes the property as-is solves all of that in one closing — which is exactly what a fix-and-flipper or a wholesaler with a rehab buyer offers. The result is a discounted, off-market sale with a clear scope of work, and it is why investors watch fire-damaged homes the way they watch notices of default.
How current is the fire data?
The list covers structure fires from January 1, 2026 through July 7, 2026 — year to date — and is refreshed weekly.
Can I download the fire-damaged homes: off-market leads for investors, flippers and wholesalers?
Yes. Inside Properant you can filter by county, city, equity, owner type, and every other signal, save the list, and export it — or upload your own list and let the platform match and enrich it. The trial is free and requires no credit card.
Build Your Fire-Damaged Homes: Off-Market Leads For Investors, Flippers And Wholesalers in Minutes
This page is one slice of it. Properant connects every parcel in California to its owner, open loans, liens and foreclosure stage — then scores and skip-traces the ones worth calling.
Want to search these 5,596 fire-damaged properties?
Explore the live California fire-damaged distressed property database in Properant.
See the Live List→7-Day Free Trial · No Credit Card Required
Top California Counties
| # | County | Count | Share of Statewide |
|---|---|---|---|
| 1 | Los Angeles County | 643 | 11.5% |
| 2 | San Diego County | 629 | 11.2% |
| 3 | Orange County | 514 | 9.2% |
| 4 | Kern County | 357 | 6.4% |
| 5 | San Bernardino County | 315 | 5.6% |
| 6 | Sacramento County | 295 | 5.3% |
| 7 | Fresno County | 235 | 4.2% |
| 8 | San Joaquin County | 218 | 3.9% |
| 9 | Stanislaus County | 185 | 3.3% |
| 10 | Ventura County | 179 | 3.2% |