Data updated October 12, 2026 · All 58 Counties
California Mechanics Lien List
As of October 12, 2026, California has 29,904 properties with open mechanics liens on record across all 58 counties.
A mechanics lien is recorded by a contractor, subcontractor, or material supplier who did work on a property and wasn't paid. It attaches to the property itself — not just the owner — and clouds the title until it's paid or released. As a distress signal it's specific in a way most liens aren't: it usually means a project stopped mid-stream or an owner's cash ran out with the work already done. Properant tracks recorded mechanics liens across all 58 counties and matches each one against recorded releases, so the list holds only claims that are still open.
Search These 29,904 Properties With Open Mechanics Liens
7-Day Free Trial · No Credit Card Required · One-Click Sign-In With Google
Sample Records
9 Real Mechanics Lien Properties In Los Angeles County
9 records pulled from the database, picked from the highest AI distress scores in the county. Click a pin or a row to light it up on the map, double-click to open the same property profile subscribers see. Owner names, mailing addresses, parcel numbers, and contacts are shown in the free trial (no credit card required).
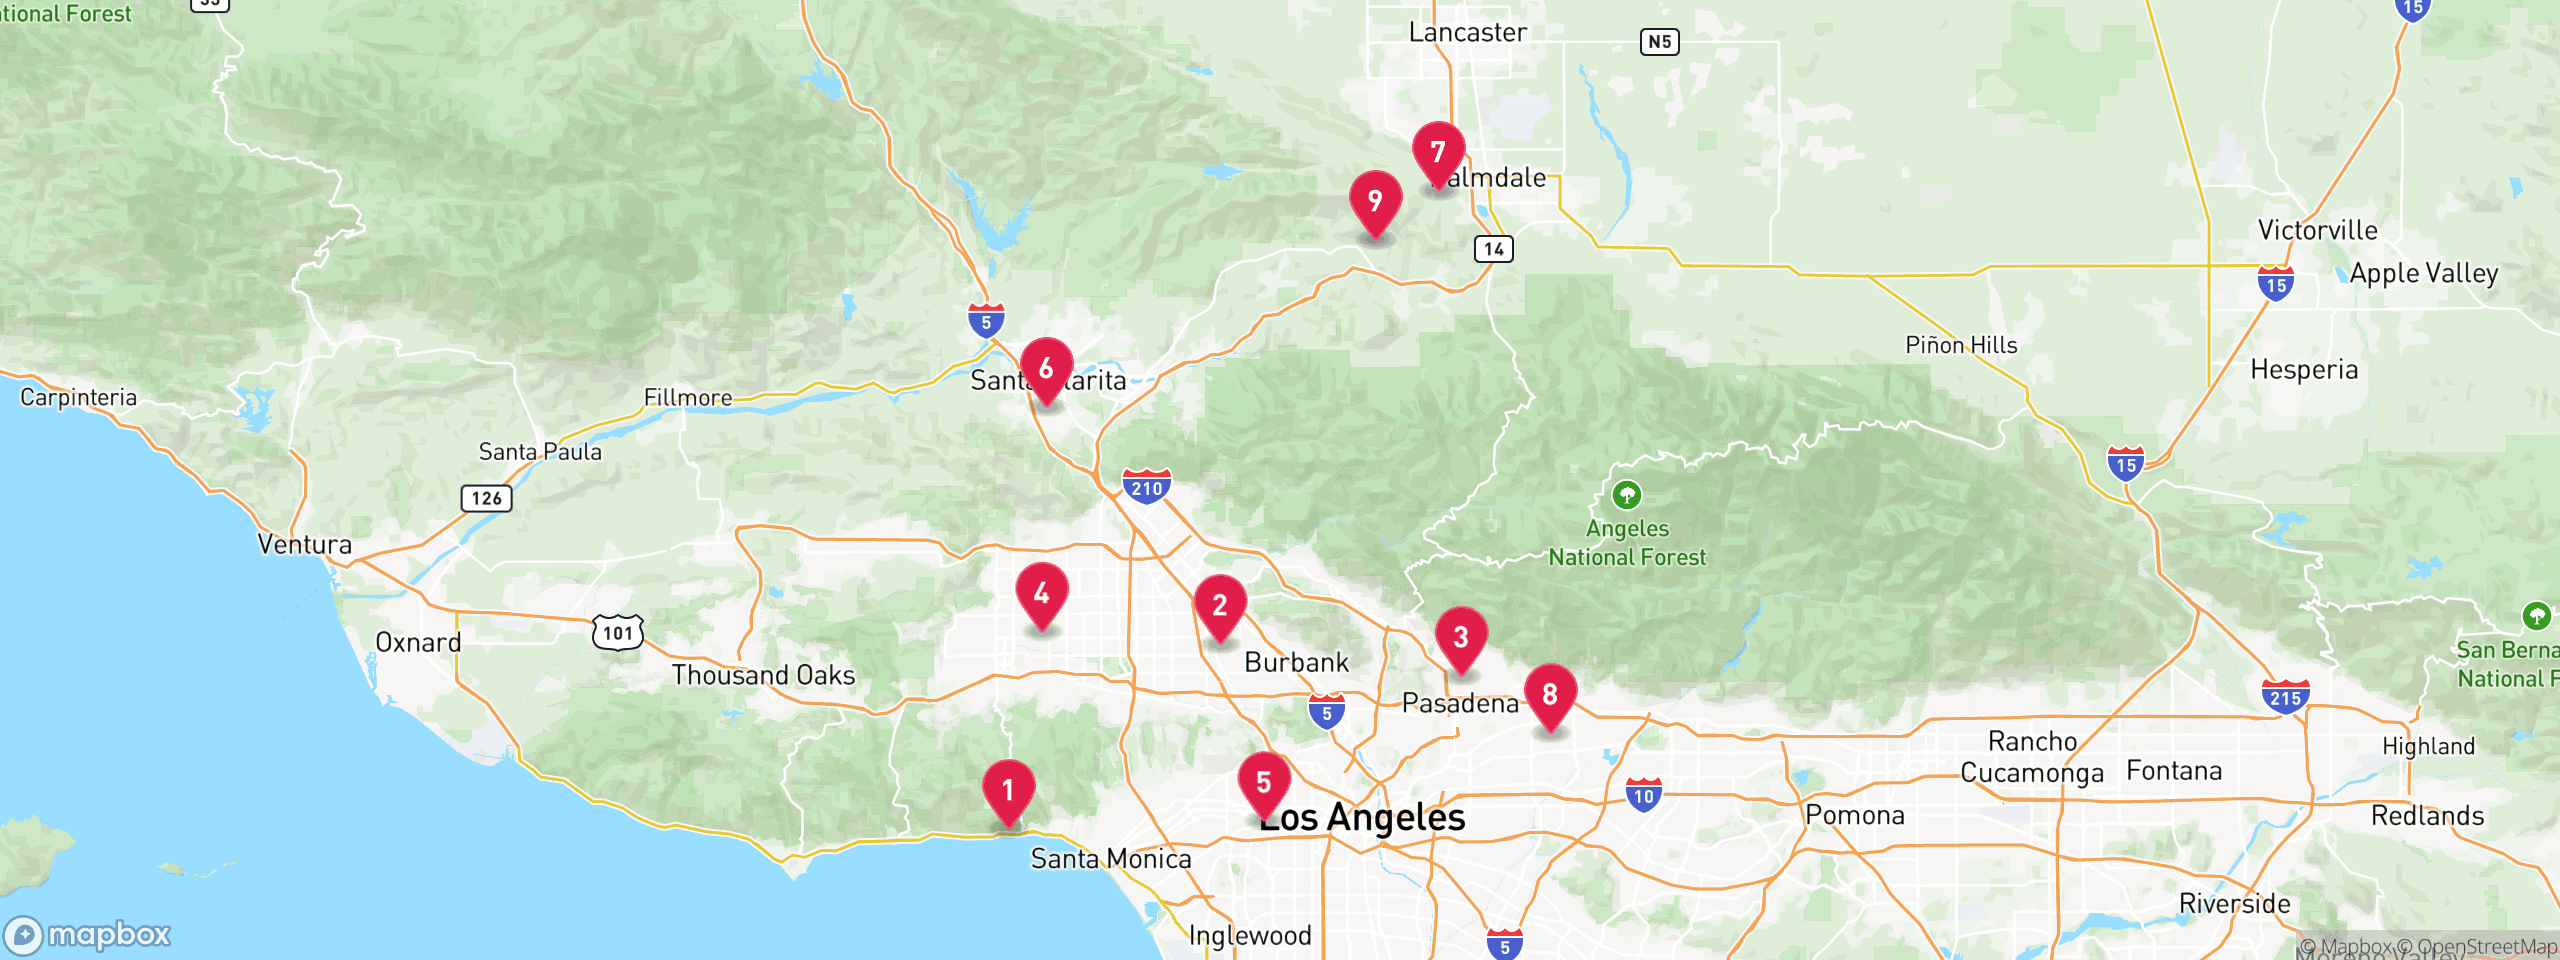
Showing: List. Switch to AI Distress Score to see how our AI ranks these ten by urgency.
| Property | Type | Value | Equity | Lien Amount | Lien Position | Score |
|---|---|---|---|---|---|---|
119144 PACIFIC COAST HWY MALIBU · 2 bd / 3 ba · 1,430 sf | Single Family | $4.98M | $1.15M23% | $47K Open Mechanics Lien | 3rd | 82 |
26651 CAMELLIA AVE NORTH HOLLYWOOD · 9 bd / 13 ba · 4,324 sf | Triplex | $1.88M | $641K34% | $56K Open Mechanics Lien | 2nd | 77 |
3374 DOUGLAS ST PASADENA · 4 bd / 2 ba · 1,402 sf | Single Family | $1.30M | $668K51% | $112K Open Mechanics Lien | 3rd | 74 |
419545 SHERMAN WAY UNIT 44 RESEDA · 3 bd / 3 ba · 1,401 sf | Condo | $534K | $156K29% | $15K Open Mechanics Lien | 3rd | 74 |
54640 LOMITA ST LOS ANGELES · 3 bd / 1 ba · 1,204 sf | Single Family | $904K | $904K100% | $1.50M Open Mechanics Lien | 1st | 72 |
623953 VIA HAMACA VALENCIA · 4 bd / 3 ba · 2,431 sf | Single Family | $952K | $339K36% | $148K Open Mechanics Lien | 3rd | 71 |
737523 PLANTAIN LN PALMDALE · 4 bd / 3 ba · 3,240 sf | Single Family | $648K | $254K39% | $32K Open Mechanics Lien | 4th | 65 |
8661 W LEMON AVE ARCADIA · 4 bd / 4 ba · 3,537 sf | Single Family | $2.91M | $2.91M100% | $345K Open Mechanics Lien | 1st | 63 |
95444 SHANNON VALLEY RD ACTON · 4 bd / 3 ba · 2,686 sf | Single Family | $910K | $468K51% | $268K Open Mechanics Lien | 2nd | 62 |
Want all 29,904 properties with open mechanics liens across California?
These ten are the sample. Owner names, mailing addresses, parcel numbers, lenders, trustees, one-click skip tracing, and direct mail are shown in the free trial (no credit card required).
The Profile
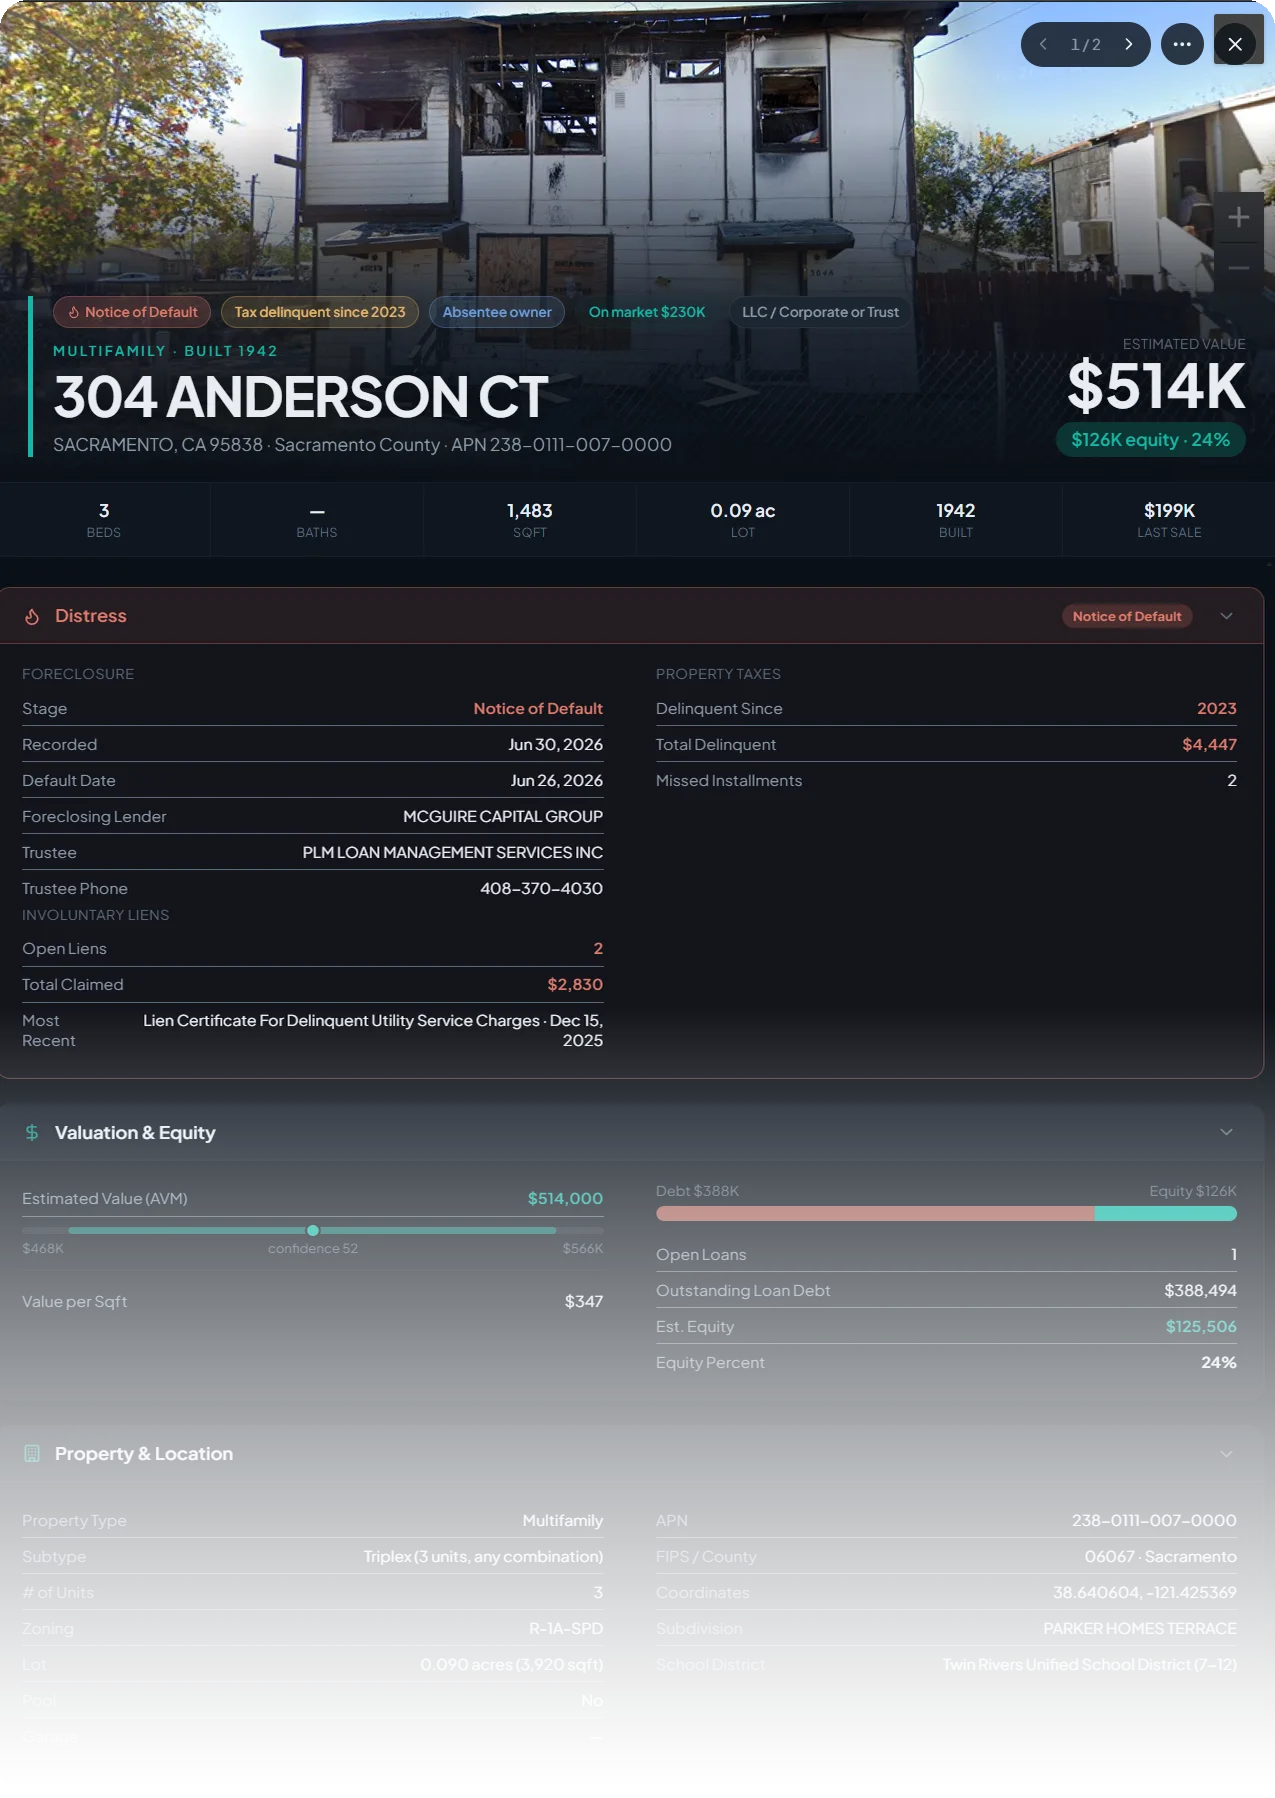
One click. The whole picture.
Every recorded lien
Tax liens, judgments, mechanics liens, HOA liens. Amounts, parties, and whether each one is still active — matched against recorded releases, so a lien on the profile is a lien that's really there.
How California's Numbers Are Moving
Change over the past week (since October 6), from Properant's daily snapshots of recorded county documents. The series grows every day.
Lien Activity In California
Live from recorded county documents, releases removed — the same records the list itself is counted from.
What's on Every Property Record
Every property shows the recorded lien amount, the claimant, and the recording date, alongside the parcel's full picture — the owner's record and mailing address, open loans, other liens, tax status, foreclosure stage, and true equity. A mechanics lien stacked on other signals is exactly what the AI distress score weighs when it ranks who needs out most.
Frequently Asked Questions
How many properties with open mechanics liens are there in California?
Properant tracks 29,904 properties with open mechanics liens across California's 58 counties as of October 12, 2026, counted from recorded county documents with releases and cancellations removed.
Why is a mechanics lien a strong motivated-seller signal?
Because it points at a specific, recent failure: work was done and the money to pay for it wasn’t there. Owners carrying an open mechanics lien often have a half-finished project, a dispute they want behind them, or a cash crunch that a sale solves — and the lien has to be dealt with at any closing, which makes a straightforward offer genuinely useful to them.
How long does a mechanics lien last in California?
The claimant generally has a short window — 90 days from recording — to file suit to enforce the lien, or it becomes unenforceable. But an expired lien doesn’t remove itself: it still sits on title until a release records, which is why stale-looking claims keep complicating sales. Properant matches every lien against recorded releases, so the list reflects what’s actually still open on record.
Can I download the mechanics lien list?
Yes. Inside Properant you can filter by county, city, equity, owner type, and every other signal, save the list, and export it — or upload your own list and let the platform match and enrich it. The trial is free and requires no credit card.
Build Your Mechanics Lien List in Minutes
This page is one slice of it. Properant connects every parcel in California to its owner, open loans, liens and foreclosure stage — then scores and skip-traces the ones worth calling.
Want to search these 29,904 properties with open mechanics liens?
Explore the live California mechanics lien database in Properant.
See the Live List→7-Day Free Trial · No Credit Card Required
Top California Counties
| # | County | Count | Share of Statewide |
|---|---|---|---|
| 1 | Los Angeles County | 8,831 | 29.5% |
| 2 | San Diego County | 3,033 | 10.1% |
| 3 | Orange County | 2,254 | 7.5% |
| 4 | Riverside County | 2,222 | 7.4% |
| 5 | San Bernardino County | 1,985 | 6.6% |
| 6 | Santa Clara County | 1,550 | 5.2% |
| 7 | Alameda County | 901 | 3.0% |
| 8 | Sacramento County | 813 | 2.7% |
| 9 | Contra Costa County | 712 | 2.4% |
| 10 | Fresno County | 660 | 2.2% |
| 11 | Kern County | 557 | 1.9% |
| 12 | San Francisco County | 447 | 1.5% |
| 13 | San Mateo County | 444 | 1.5% |
| 14 | Ventura County | 443 | 1.5% |
| 15 | Sonoma County | 407 | 1.4% |